Most contractors know ServiceTitan has reports. Fewer trust them. And a report you don’t trust is a report you stop opening.
Alishia Conley, Lead Consultant at Powerhouse Consulting Group, sees it all the time.
“A lot of contractors just don’t trust their data,” she said.
Alishia has more than 10 years in the trades, working in HVAC, plumbing, generators, and water treatment. She has been a dispatcher, membership coordinator, admin, office manager, regional trainer, and director of operations. She has used reports from every side of the business.
Her view: ServiceTitan Reporting is your checks and balances.
“You should be able to check your reports anytime and be able to validate the data somewhere, whether that be QuickBooks or recent job records,” she said.
Here is how to build a reporting routine you can trust.
ServiceTitan Reporting covers almost every part of the platform: jobs, invoices, AR, memberships, and more. Each report starts from a template, and each template type has its own set of data. Most offer somewhere between 70 and 100 column options, so there’s a lot of room to customize.
A few things to know up front:
Alishia’s go-to starting point is the Productivity report. It gives a quick snapshot of what each division is doing, how your job types are performing, and where your revenue stands. If something stands out, move to a more detailed report to dig in.
In addition to the productivity report, there are four more Alishia recommends every contractor run. They’re also the ones she sees overlooked most often:
Why do they get skipped? Often the preset columns don’t show the data people need. Alishia resets them to the big buckets first: jobs completed, on hold, recalled, and warranty. Once those are tracking correctly, add more columns.
These reports also tell you when something in your process breaks. A number that suddenly looks off is often the first sign a workflow needs attention.
Scheduled reports are flexible. You can send them on certain days, at certain times, to certain people. You can also limit a report so each person only sees their own data. For example, a CSR can get their call performance from the day before without seeing anyone else’s.
Alishia’s suggested rhythm:
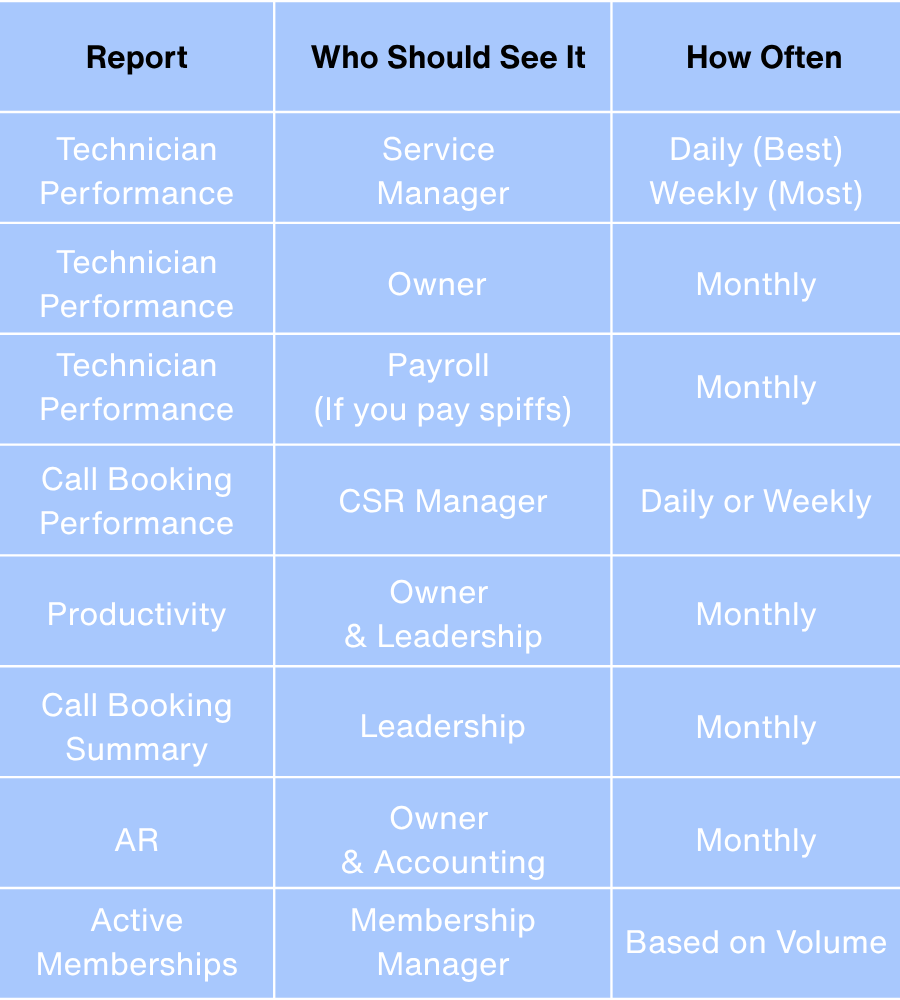
The right frequency also depends on each person’s capacity. Daily is the goal where it’s realistic.
Memberships. Run the Active Memberships report and have someone own it. It shows what’s active, expiring, and canceled, and whether recurring services and billing are in place. How much time it takes depends on your numbers:
One note: expiring credit cards don’t show on the Active Memberships report. Alishia uses the expiring credit cards view on the Follow-Up tab for that.
Pricebook. Alishia’s two favorites are Invoice Item Detail (with pricebook information) and Item Consumption. Invoice Item Detail shows what’s being used on invoices: materials, equipment, and services. Item Consumption shows how items are being used. She runs both and checks that they tell a similar story.
Marketing. Her favorite is the Campaign Summary report. Filter it heavily, and it’s a strong one. Sales from marketing leads and inbound campaign tracking reports help too.
If ServiceTitan goes down, you still need to know where your techs are going. First, make sure your fallback is turned on. Then keep these handy:
This is the step that makes the rest work. Reports are only as good as the workflows behind them.
“Your workflow has got to be accurate for the data to be good,” Alishia said.
Example: if you know you had 15 jobs yesterday and Productivity shows 14, find out why. Is the job in progress? On hold? Still in a scheduled status? There is a reason it’s not there, and in Alishia’s experience, jobs on hold or stuck in scheduled status are the most common cause.
Here’s a quick way to check. In the report results, click the number bubble in a column. It drops down to show the exact jobs it’s counting. Toggle back and forth between the report and the jobs until you find the gap.
The more often you look, the faster you’ll catch a broken link in the chain.
Once your reports show what you need, building a custom dashboard is the easy part. Share it with the right people or put it up on a screen to track data as it happens.
Ideas Alishia likes:
Most report columns can become their own tile on a dashboard, and you can rename them. The catch: you can’t always filter a single tile. For example, you may not be able to remove PTO from a pay time tile. For anything that needs heavy filtering, bring over the full report instead.
If you run multiple tenants through Enterprise Hub, use roll-up reporting. Alishia also recommends scheduled reports out of each tenant on a set rhythm, so you can check that the roll-up numbers are right. Timing and permissions can both affect what shows up.
A quick note on sharing: you can export a report, but you can’t import a custom one into another account. You can bring in report types from ServiceTitan’s library on Titan Exchange.
Pick one report. Set your columns. Then figure out why the data doesn’t match what you think it should say.
It might be a column that doesn’t mean what you thought. It might be jobs sitting on hold or in scheduled status. Either way, digging in shows you exactly what needs to be fixed in your workflow.
Want reporting you can trust? Powerhouse Consulting Group helps skilled trades companies clean up their workflows, build the right ServiceTitan reports and dashboards, and get data their teams can count on. [Let’s talk.]